IMGT/StatClonotype Documentation
https://www.imgt.org
IMGT®, the international ImMunoGeneTics information system®

| Introduction |
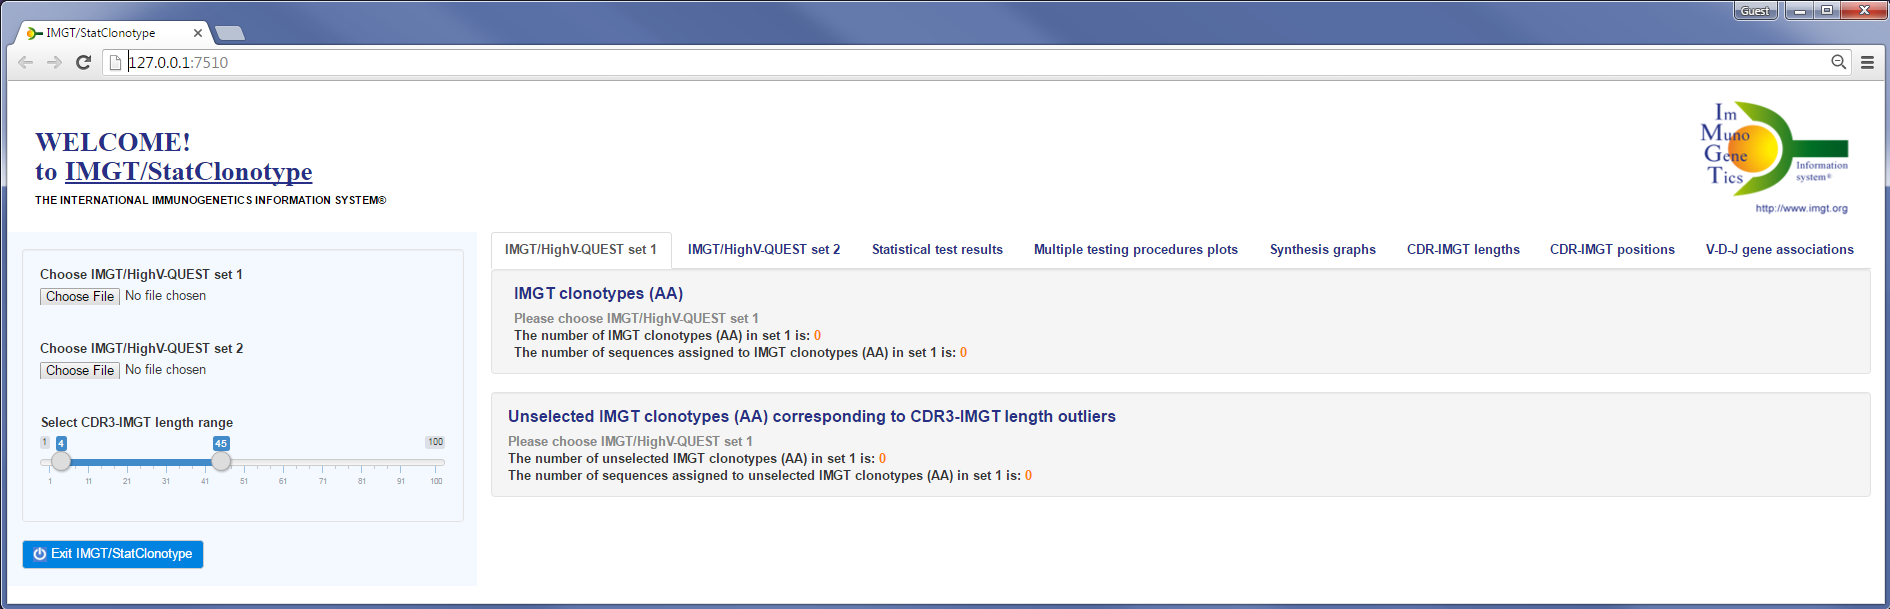
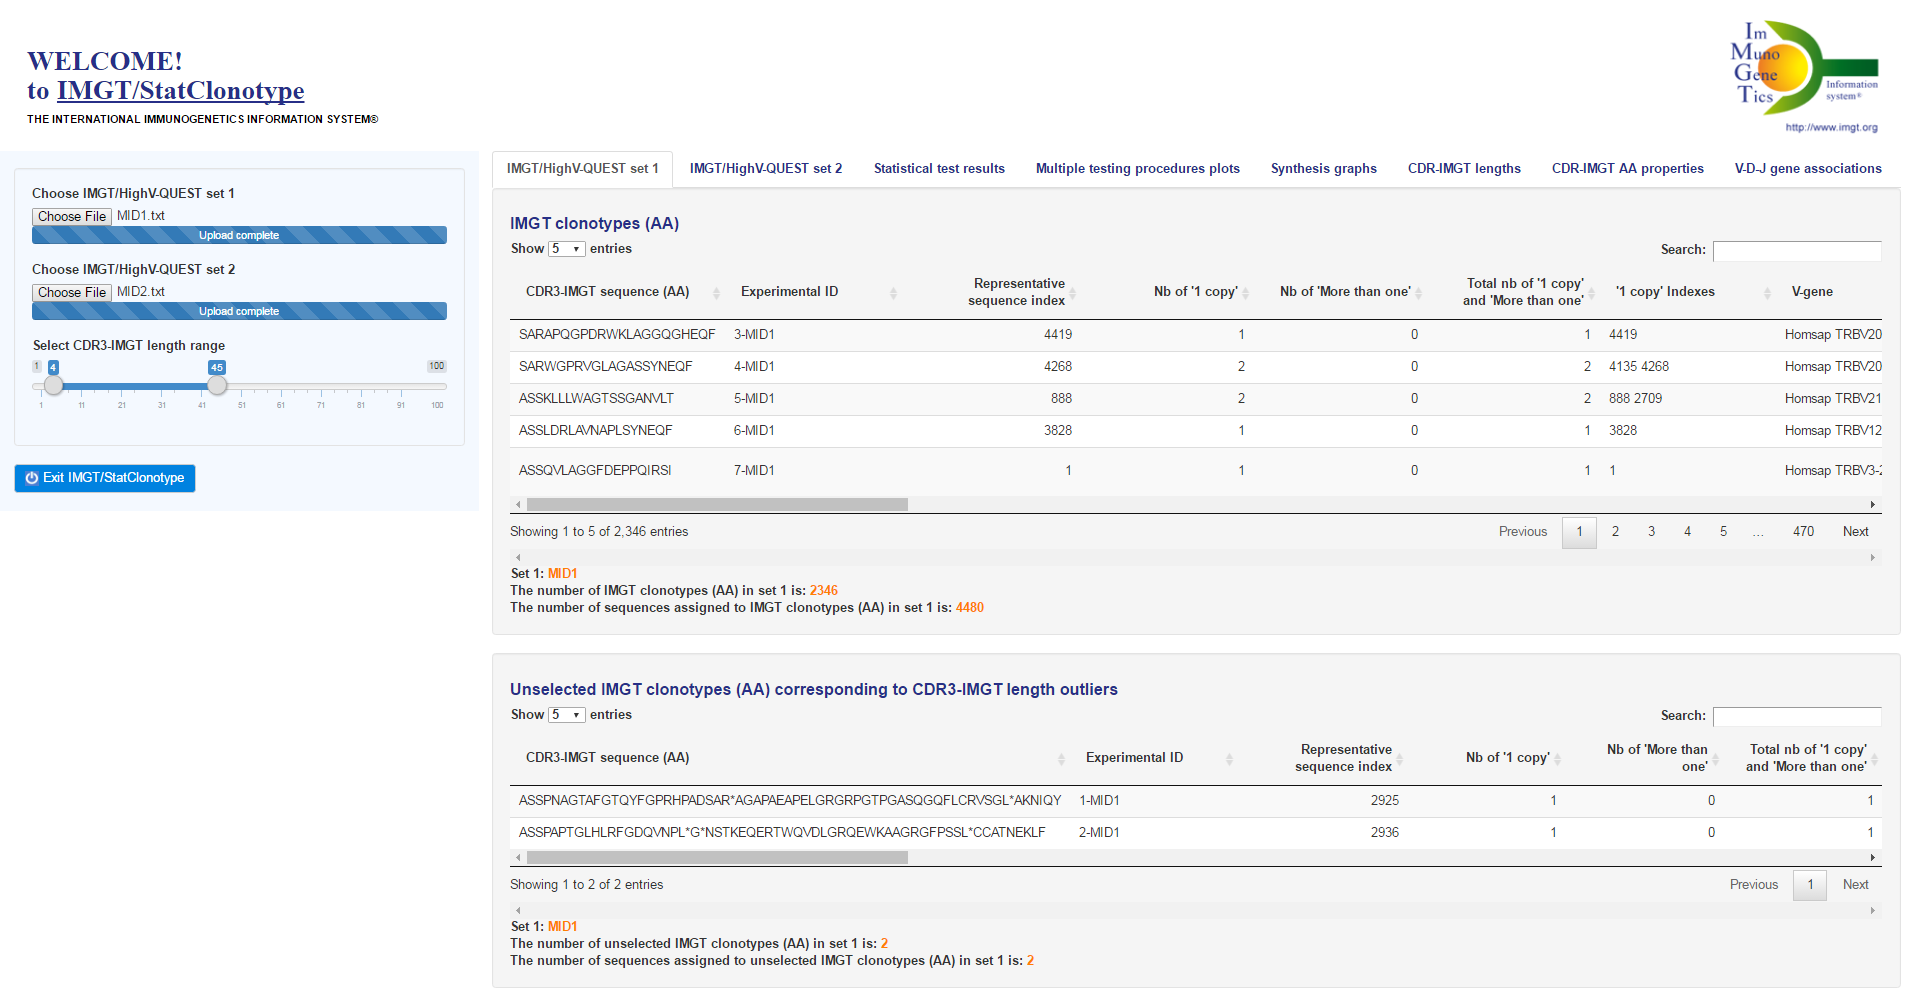
 IMGT/StatClonotype works only with uploaded files (.txt format) from the IMGT/HighV-QUEST statistical analysis output ('stats_xxx' file available in 'data' directory of the IMGT/HighV-QUEST statistical analysis output where 'xxx' is the batch name and the locus type) as described in section B.
| 'IMGTStatClonotype' R package installation |
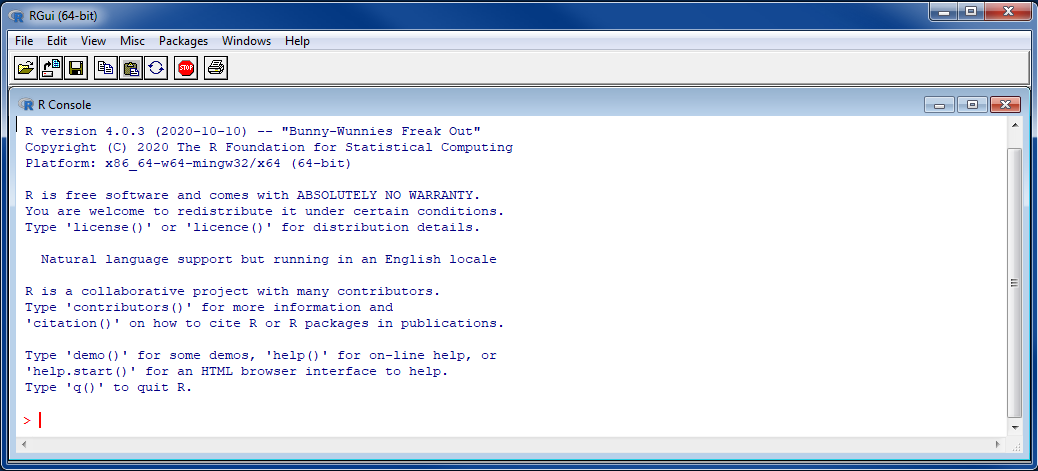
Note that: If R is already installed on your computer please check if you have a recent version (>=4.0.3).
 For Windows operating system
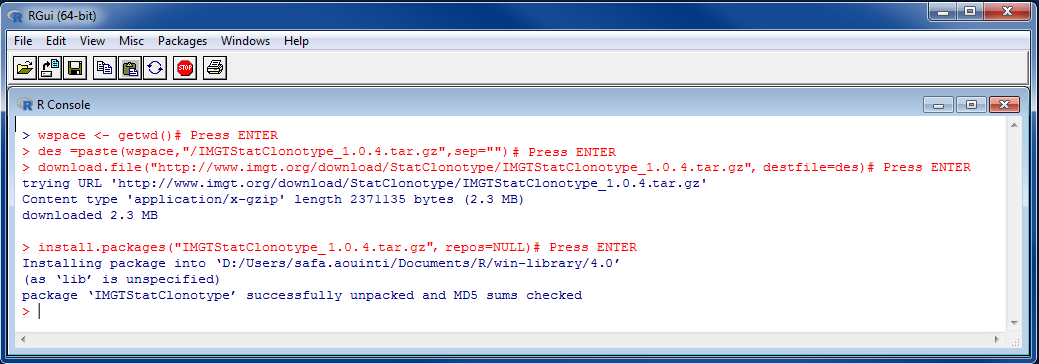 See the user manual for more details: IMGTStatClonotype-manual
For non-Windows operating system (Linux or Macintosh)
See the user manual for more details: IMGTStatClonotype-manual
For non-Windows operating system (Linux or Macintosh)| IMGT/StatClonotype web tool |
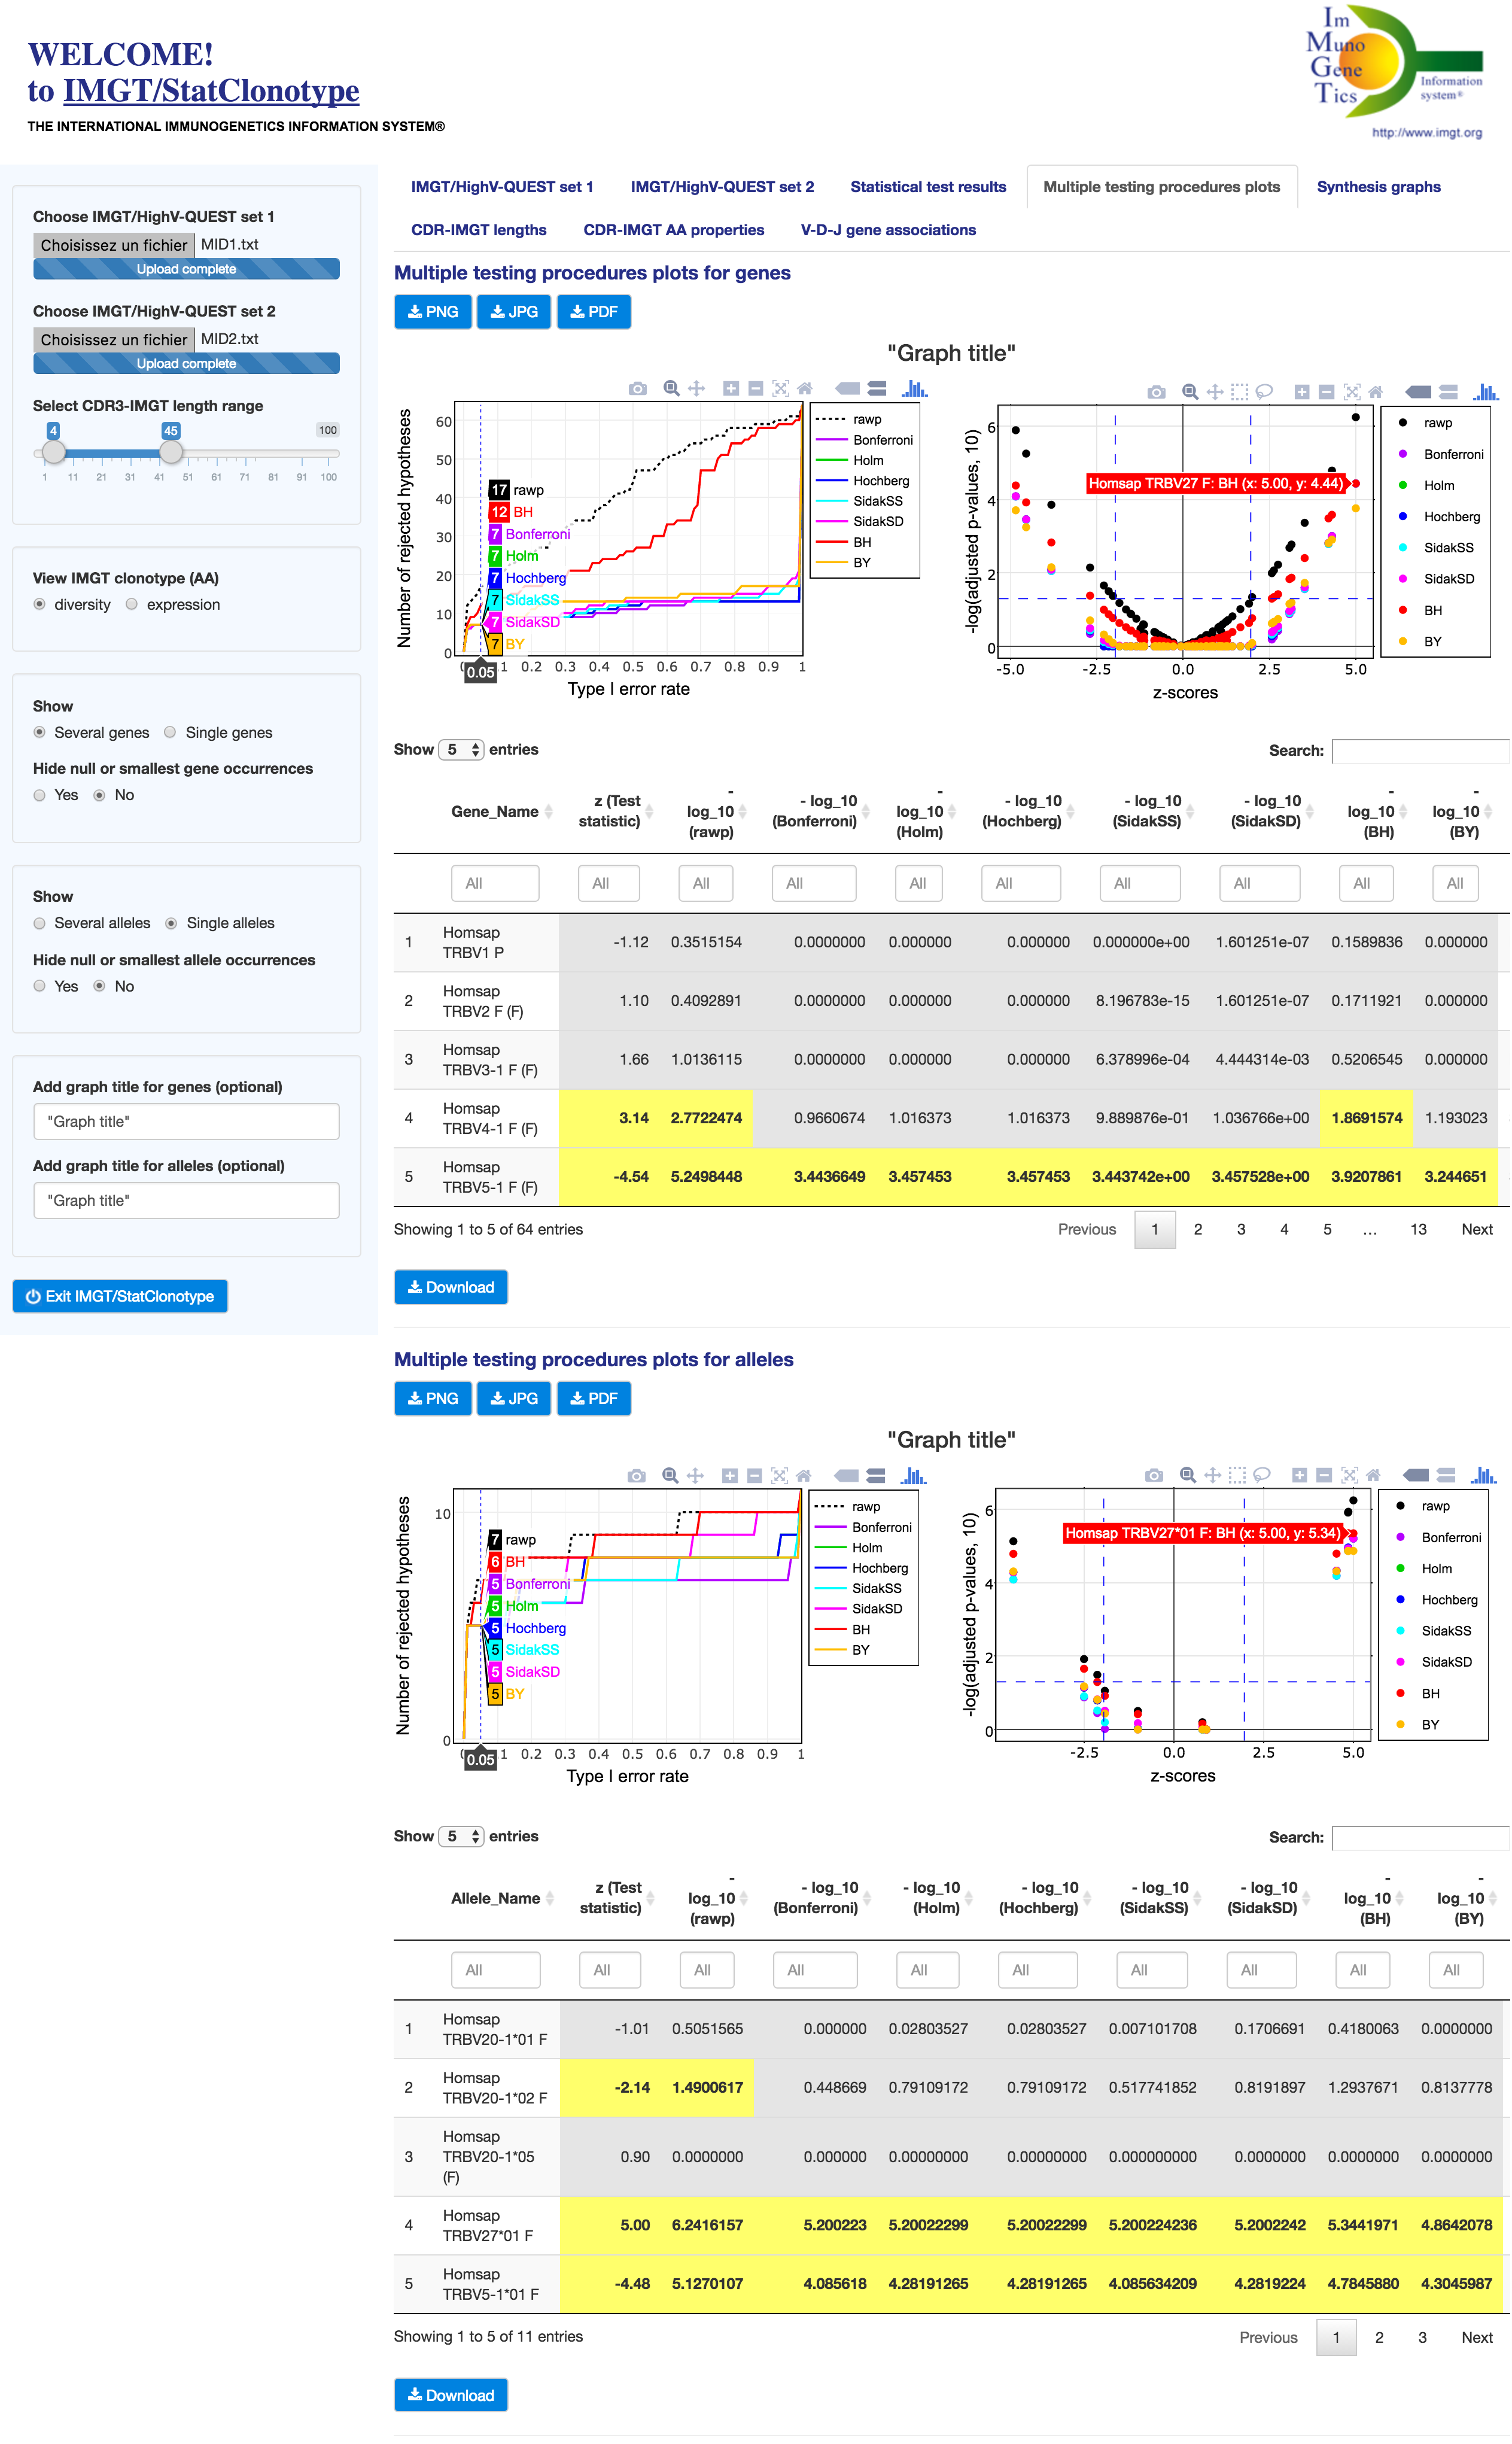
 Reminder: Properties of the multiple testing procedures (see [1] for more details)
| Procedures | Type of control | Algorithm structure | dependence of p-values under H0 | Properties |
| Bonferroni | FWER | Single-step | Ignorance | The most conservative |
| Šidák (SS) | FWER | Single-step | Independence | Less conservative than Bonferroni |
| Holm | FWER | Step-down | Ignorance | Less conservative than Bonferroni |
| Šidák (SD) | FWER | Step-down | Dependence | Similar to Holm |
| Hochberg | FWER | Step-up | Independence | Step-up of Holm |
| Benjamini & Hochberg (BH) | FDR | Step-up | Independence | The least conservative |
| Benjamini & Yekutieli (BY) | FDR | Step-up | Ignorance | More conservative than BH |
 We assume that the two compared sets are independent and the individual tests are independent of each other (i.e., multiple hypotheses are independent).
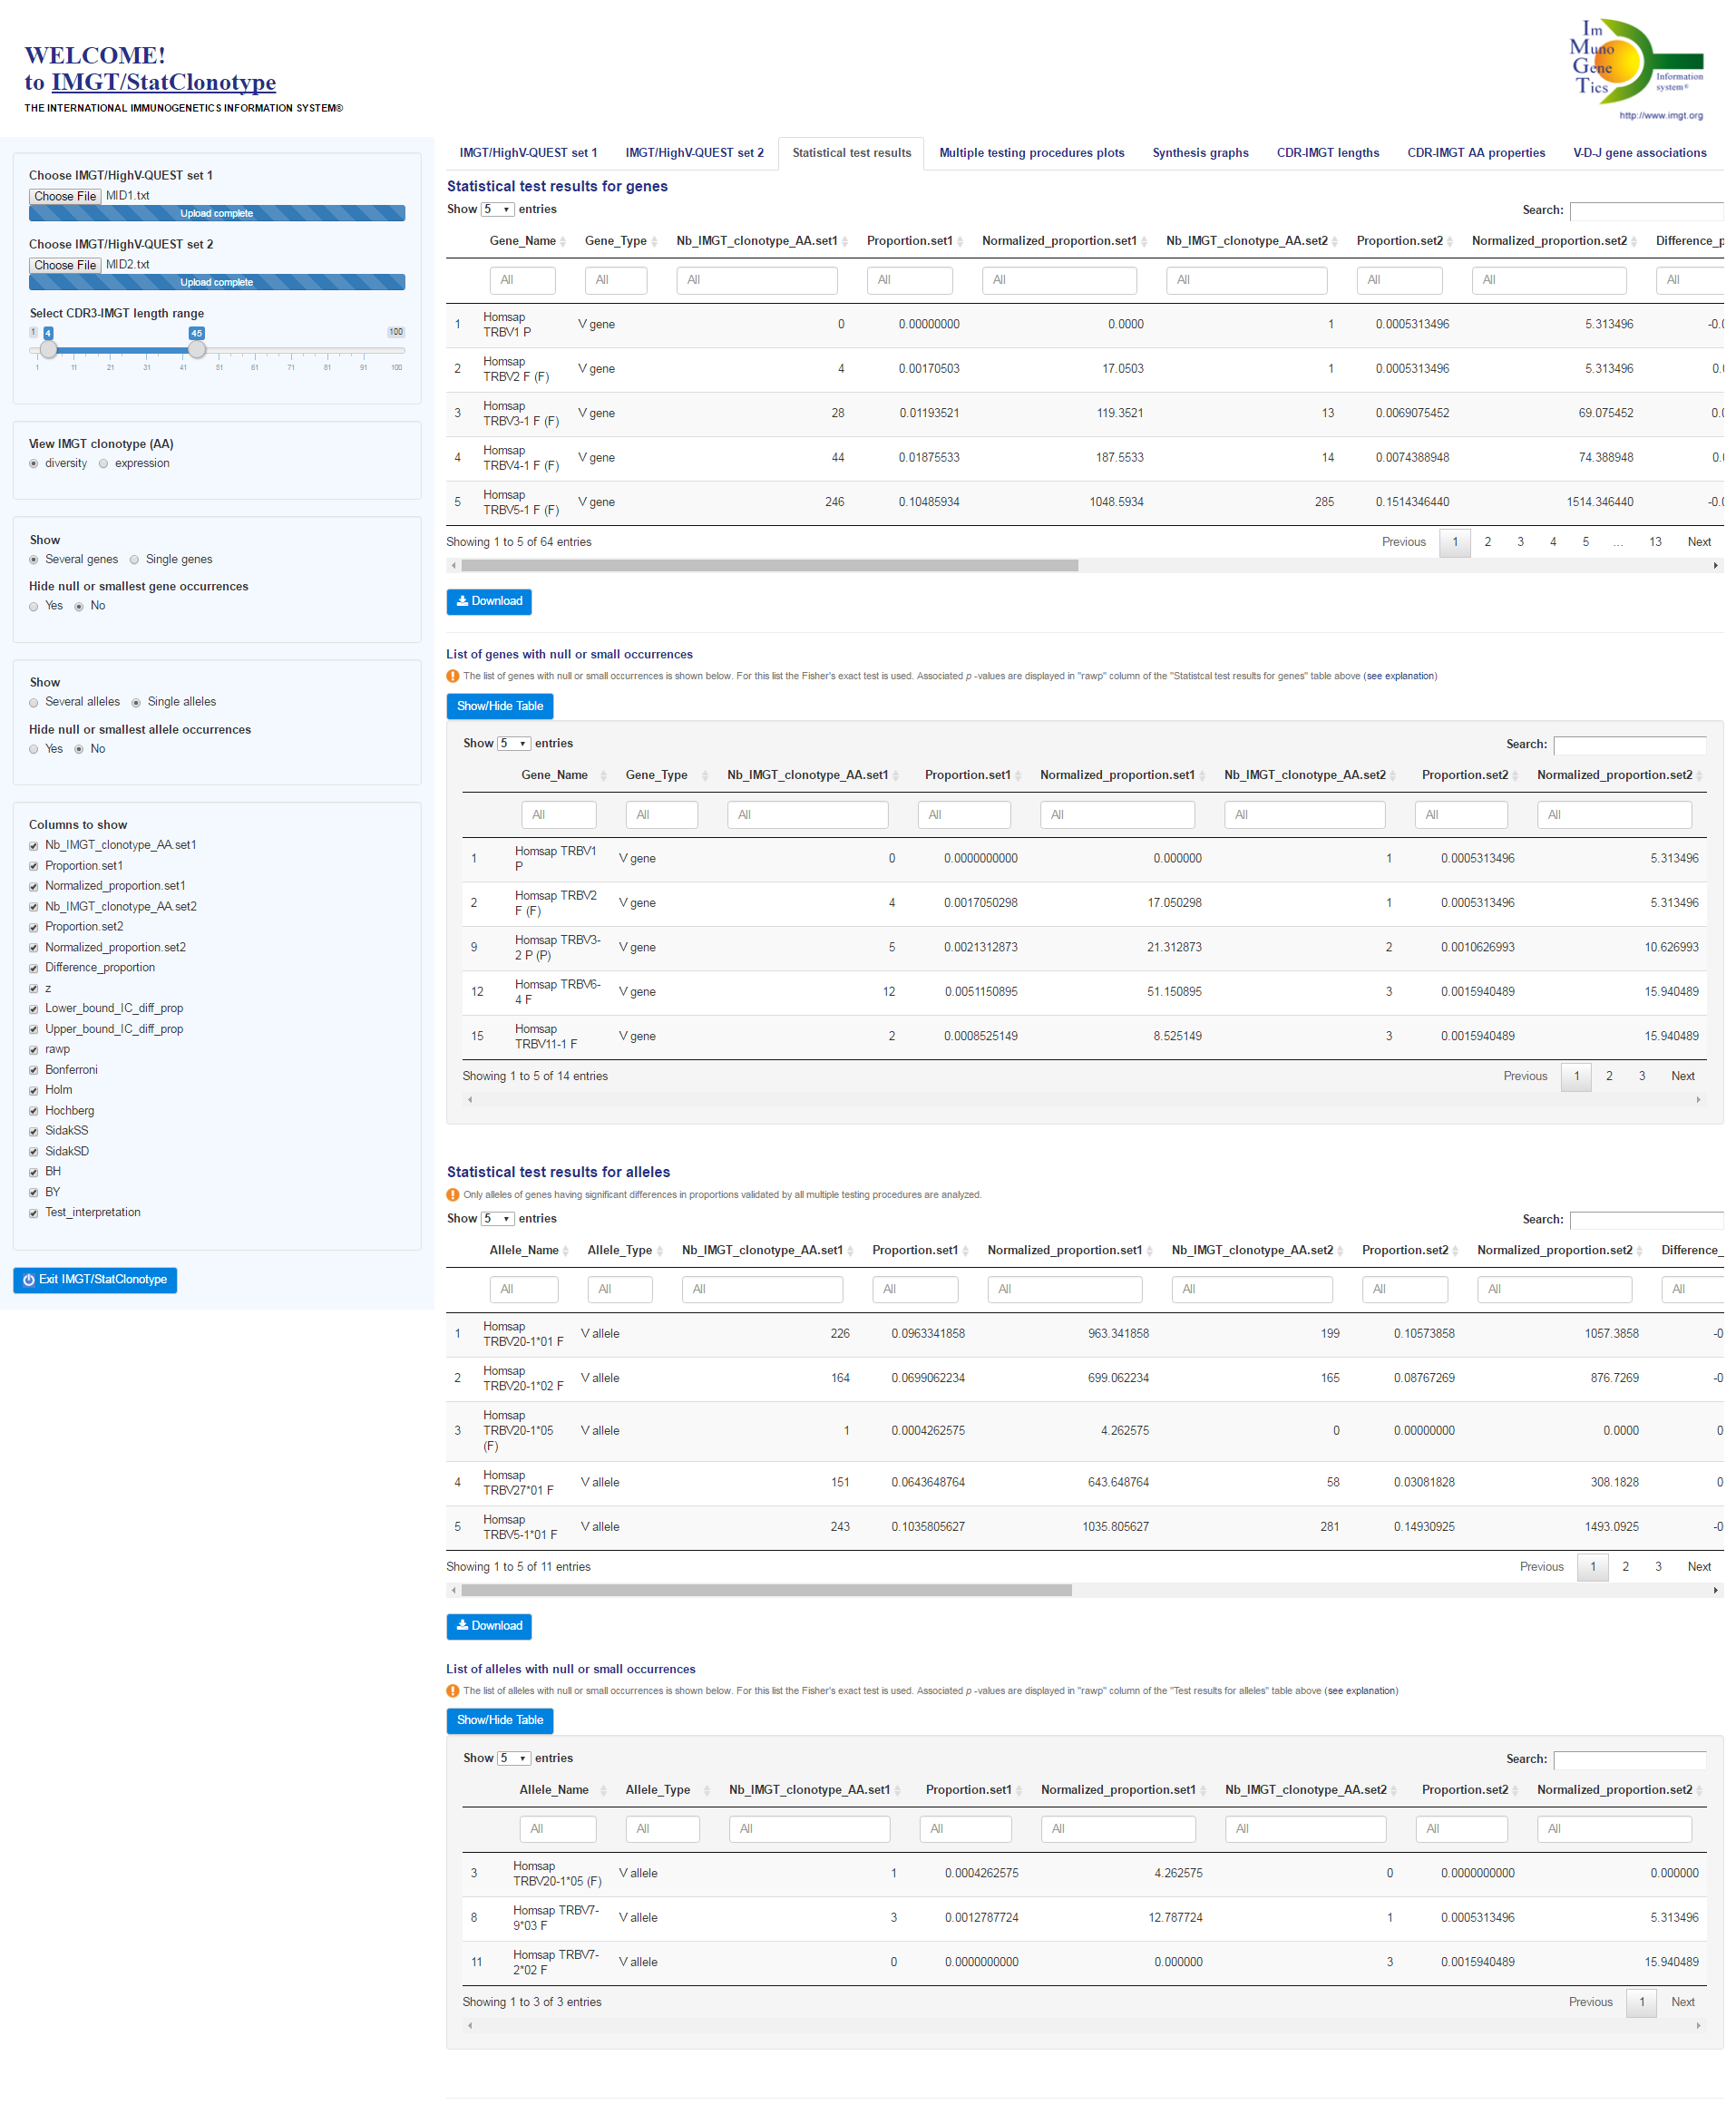
For this list of genes the Fisher's exact test is used and associated p-values are displayed in "rawp" column of the "Test results for genes" table.
Only alleles of genes having significant differences in proportions validated by all multiple testing procedures are analyzed.
For this list of alleles the Fisher's exact test is used and associated p-values are displayed in "rawp" column of the "Test results for alleles" table.
We assume that the two compared sets are independent and the individual tests are independent of each other (i.e., multiple hypotheses are independent).
For this list of genes the Fisher's exact test is used and associated p-values are displayed in "rawp" column of the "Test results for genes" table.
Only alleles of genes having significant differences in proportions validated by all multiple testing procedures are analyzed.
For this list of alleles the Fisher's exact test is used and associated p-values are displayed in "rawp" column of the "Test results for alleles" table.
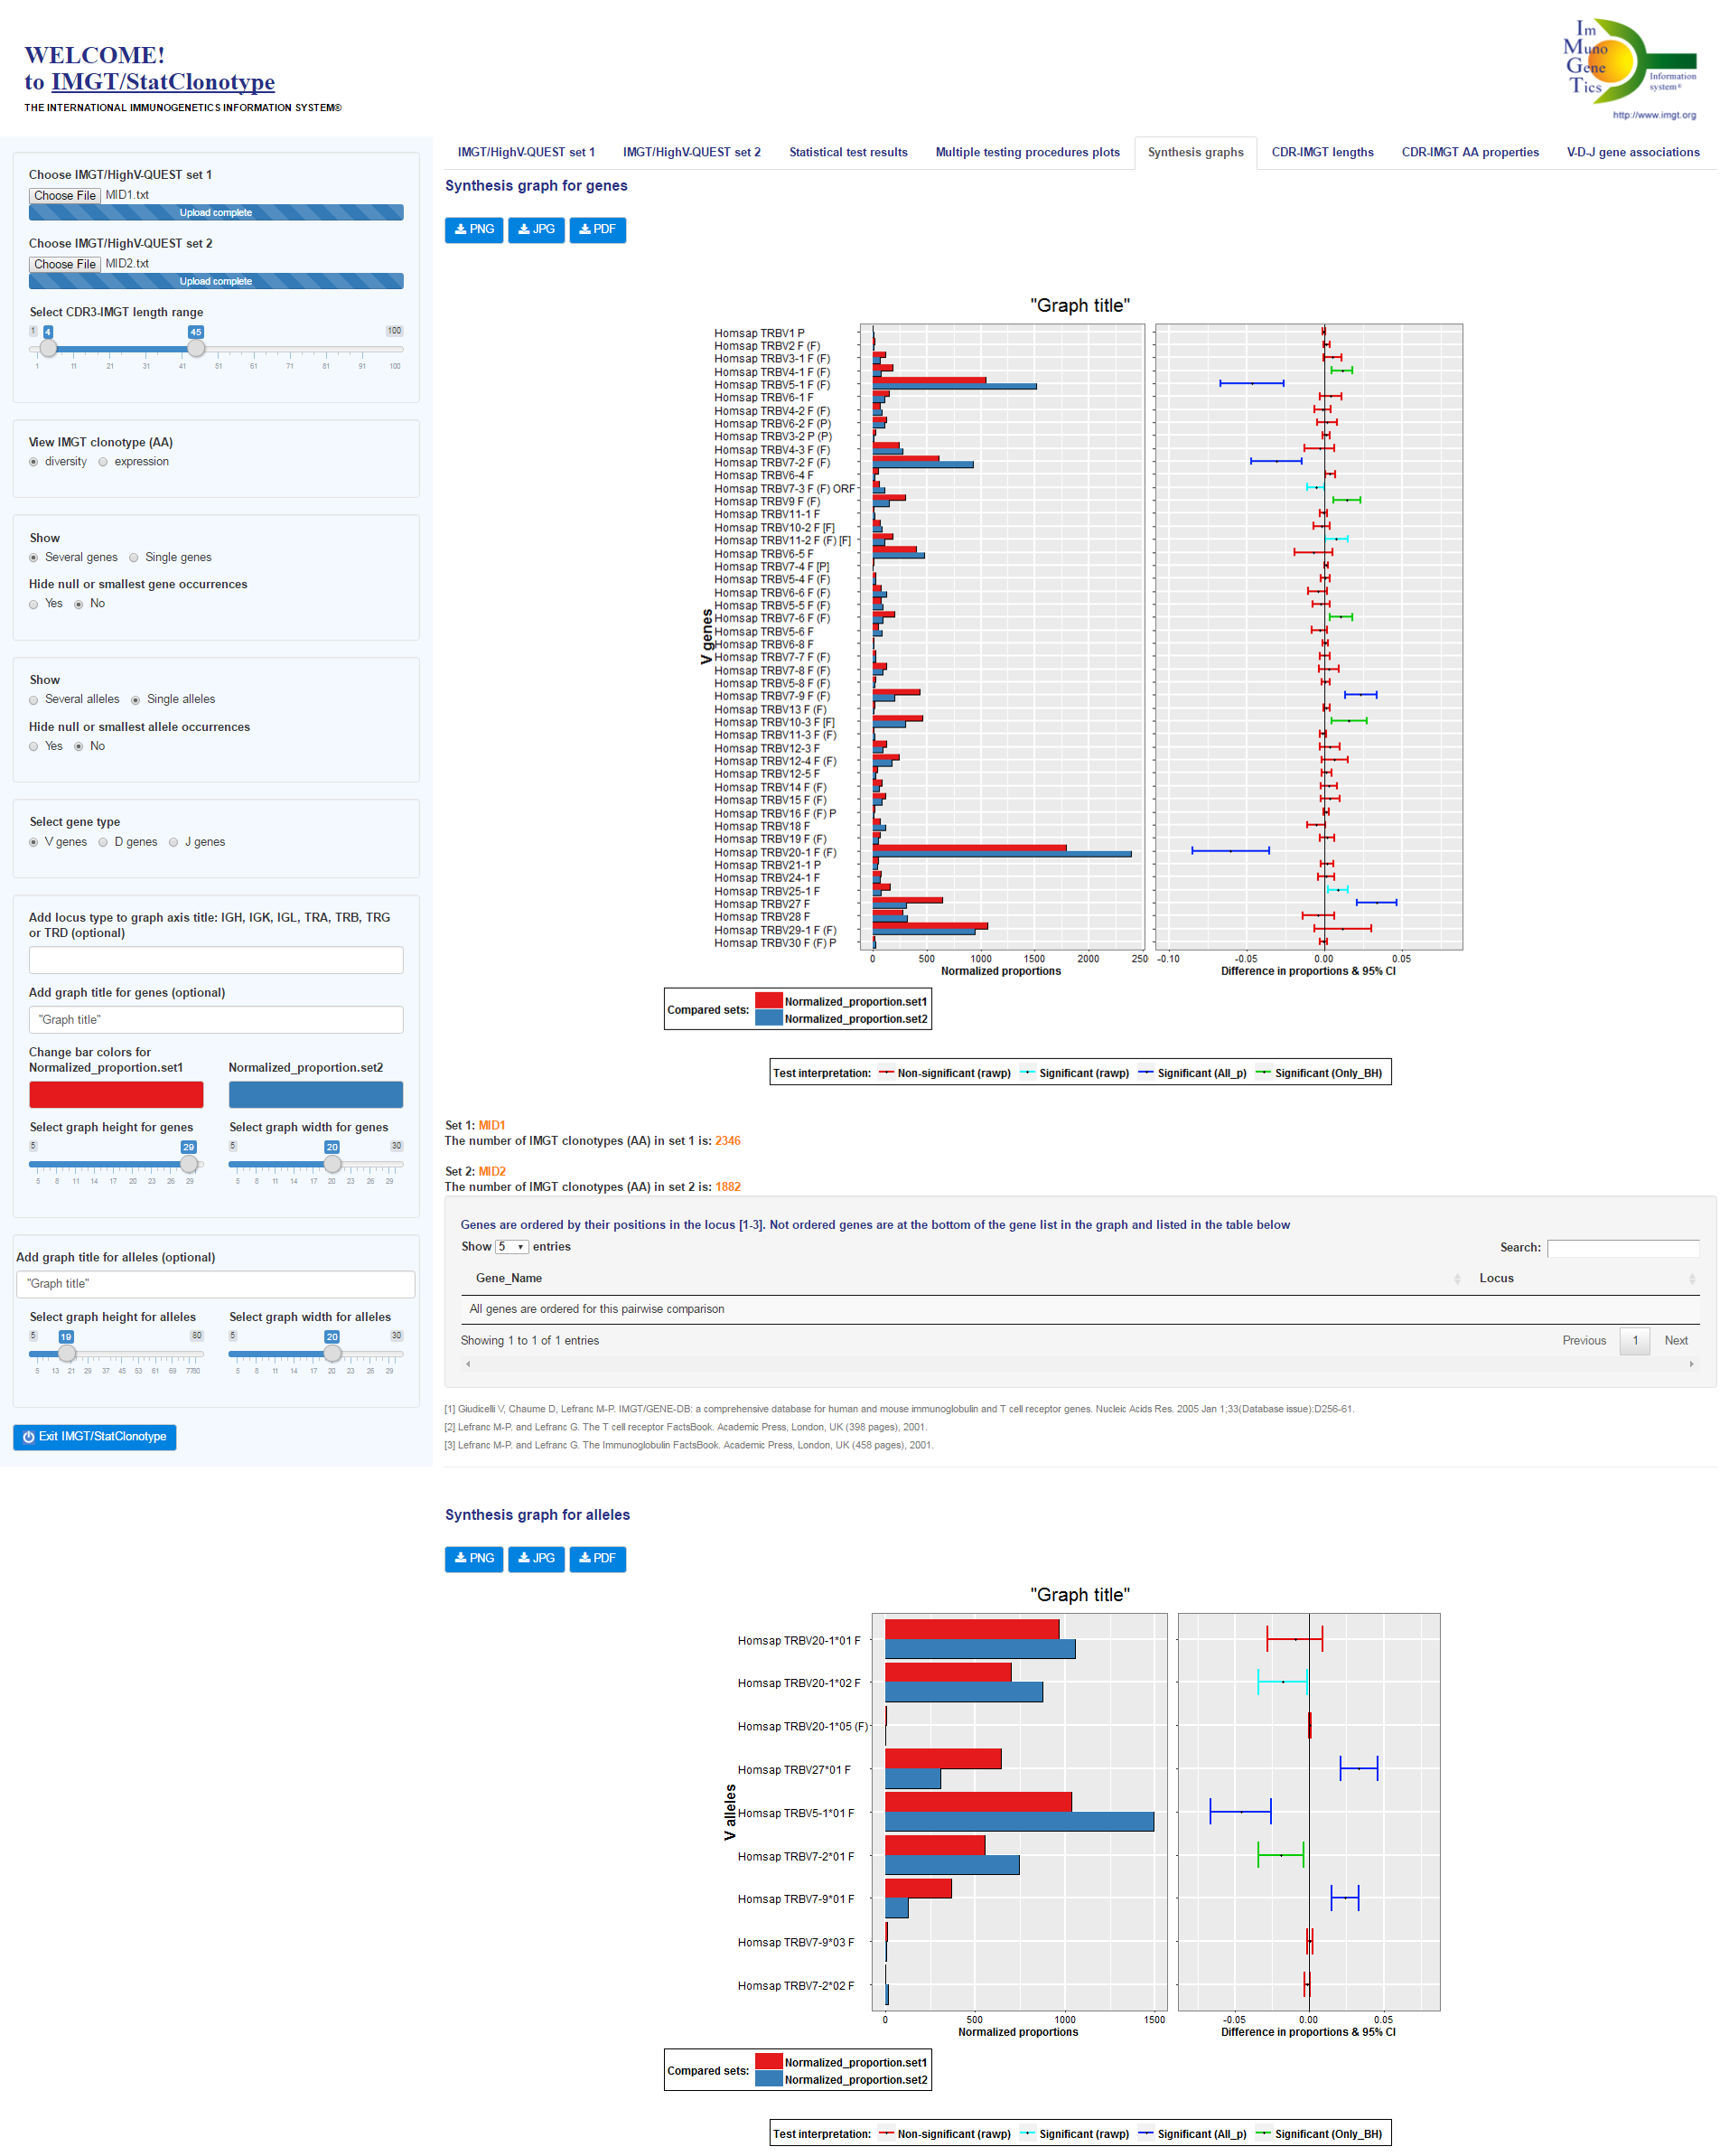
 Reminder: Only alleles of genes having significant differences in proportions validated by all multiple testing procedures are analyzed and visualized.
Note that:
Reminder: Only alleles of genes having significant differences in proportions validated by all multiple testing procedures are analyzed and visualized.
Note that:
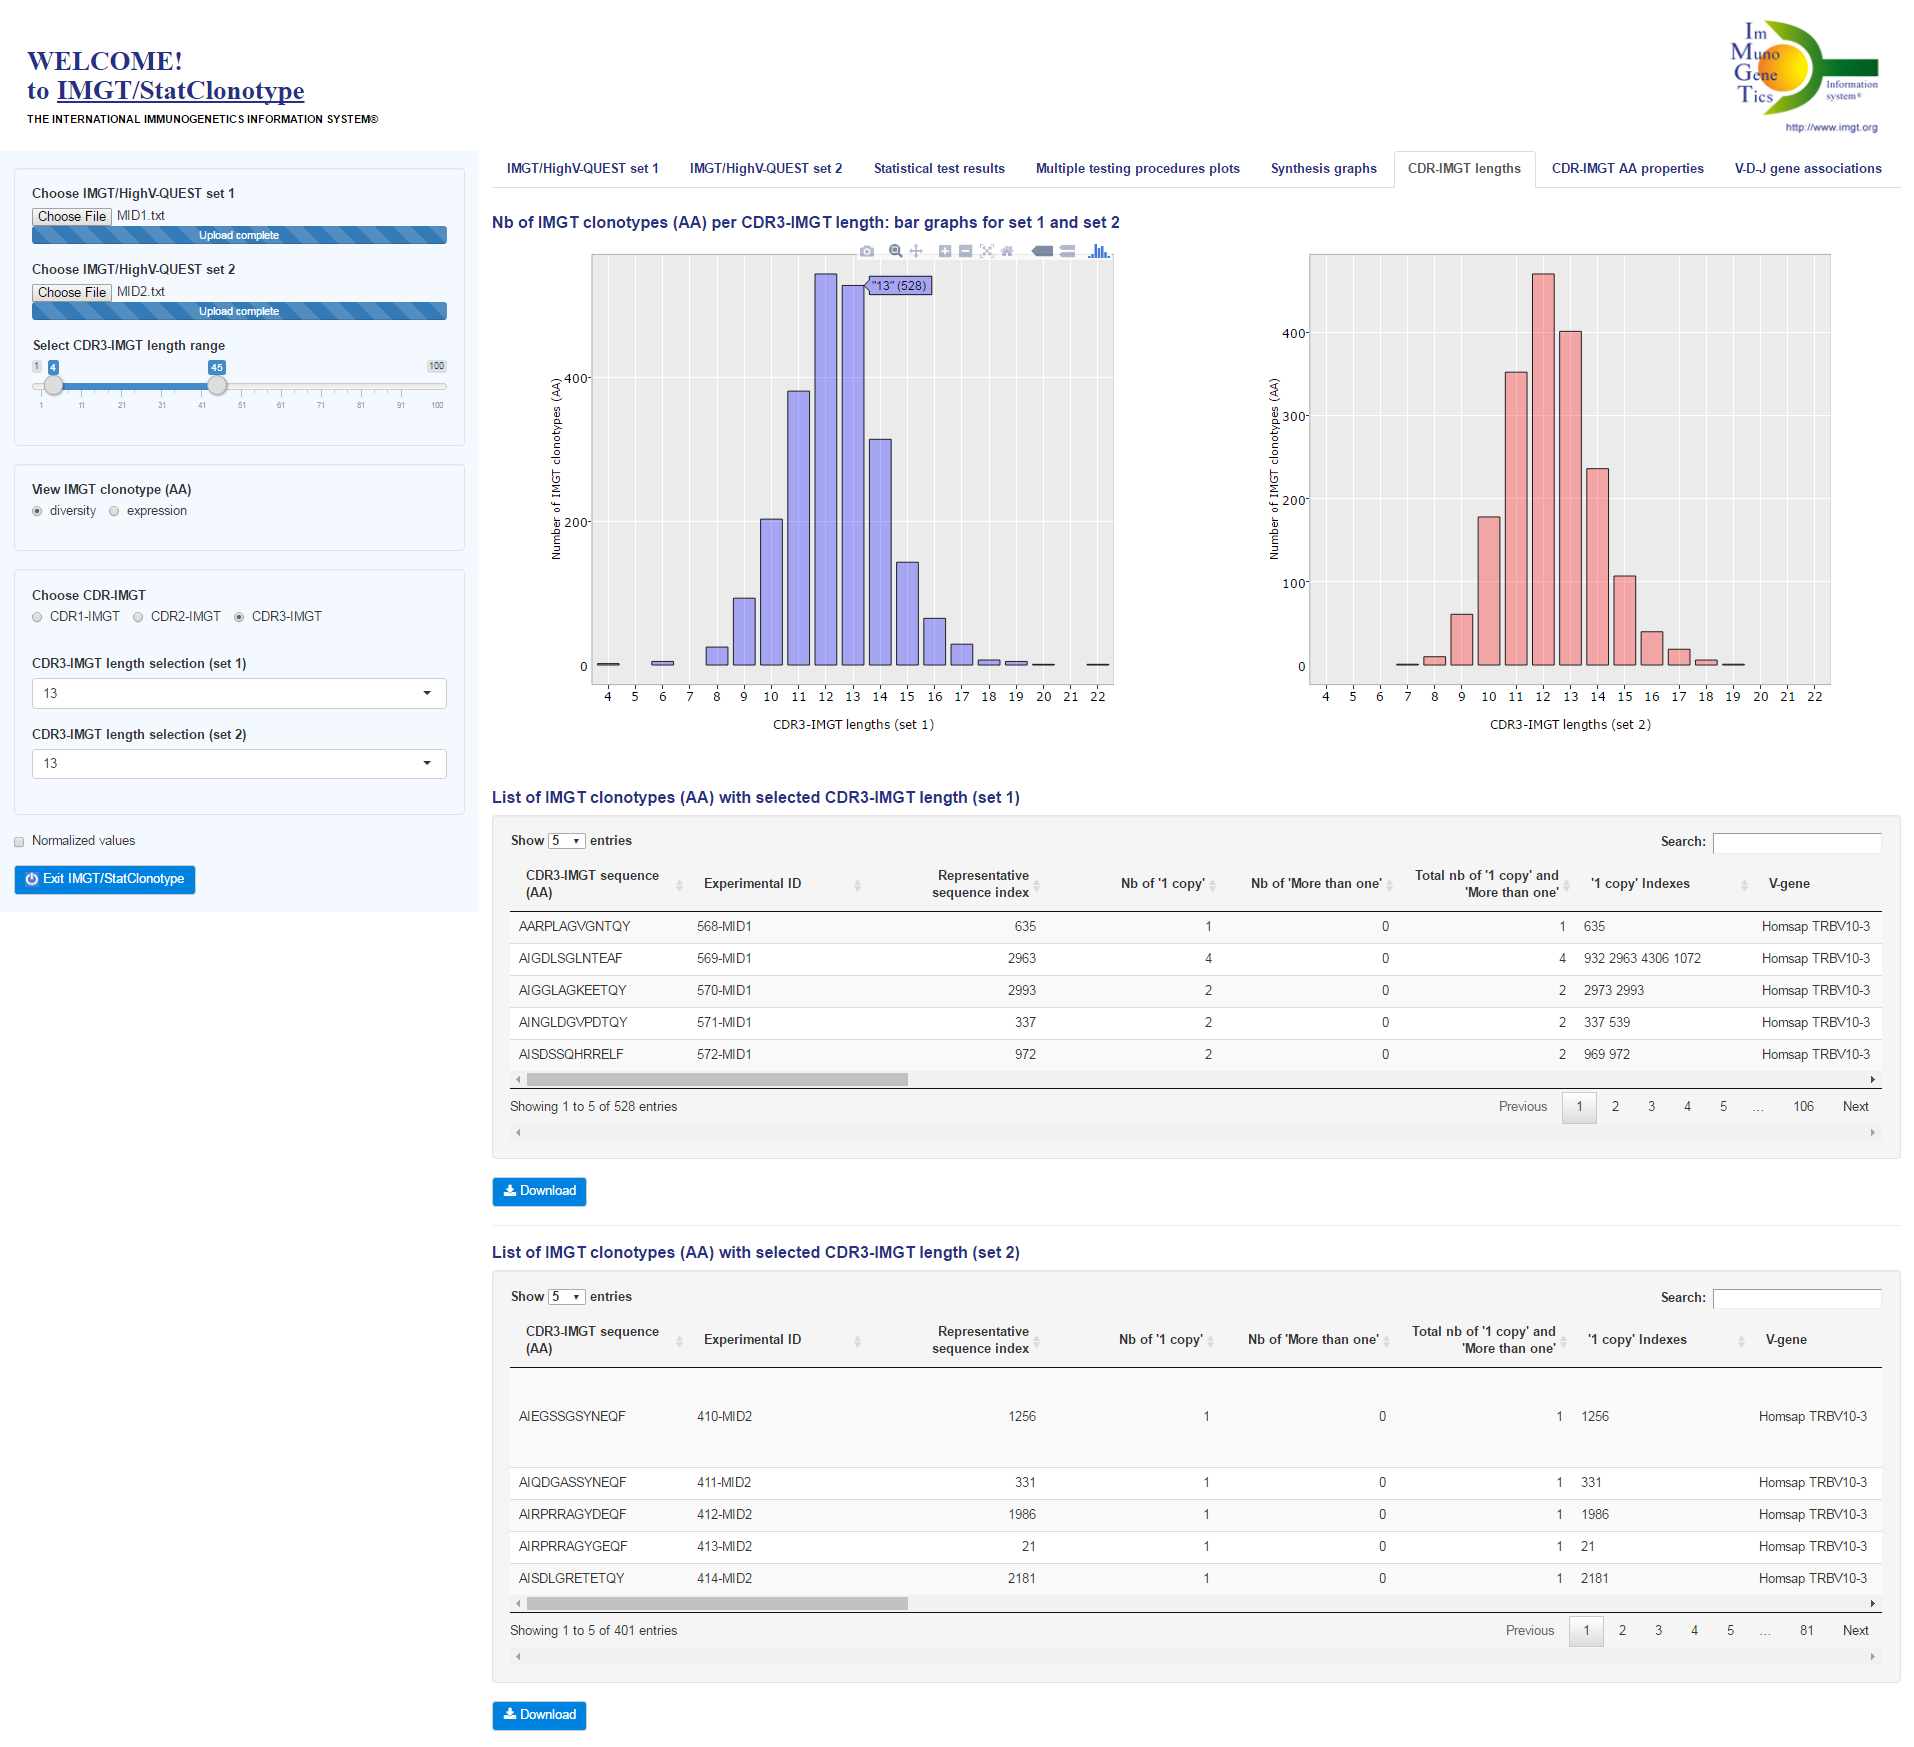
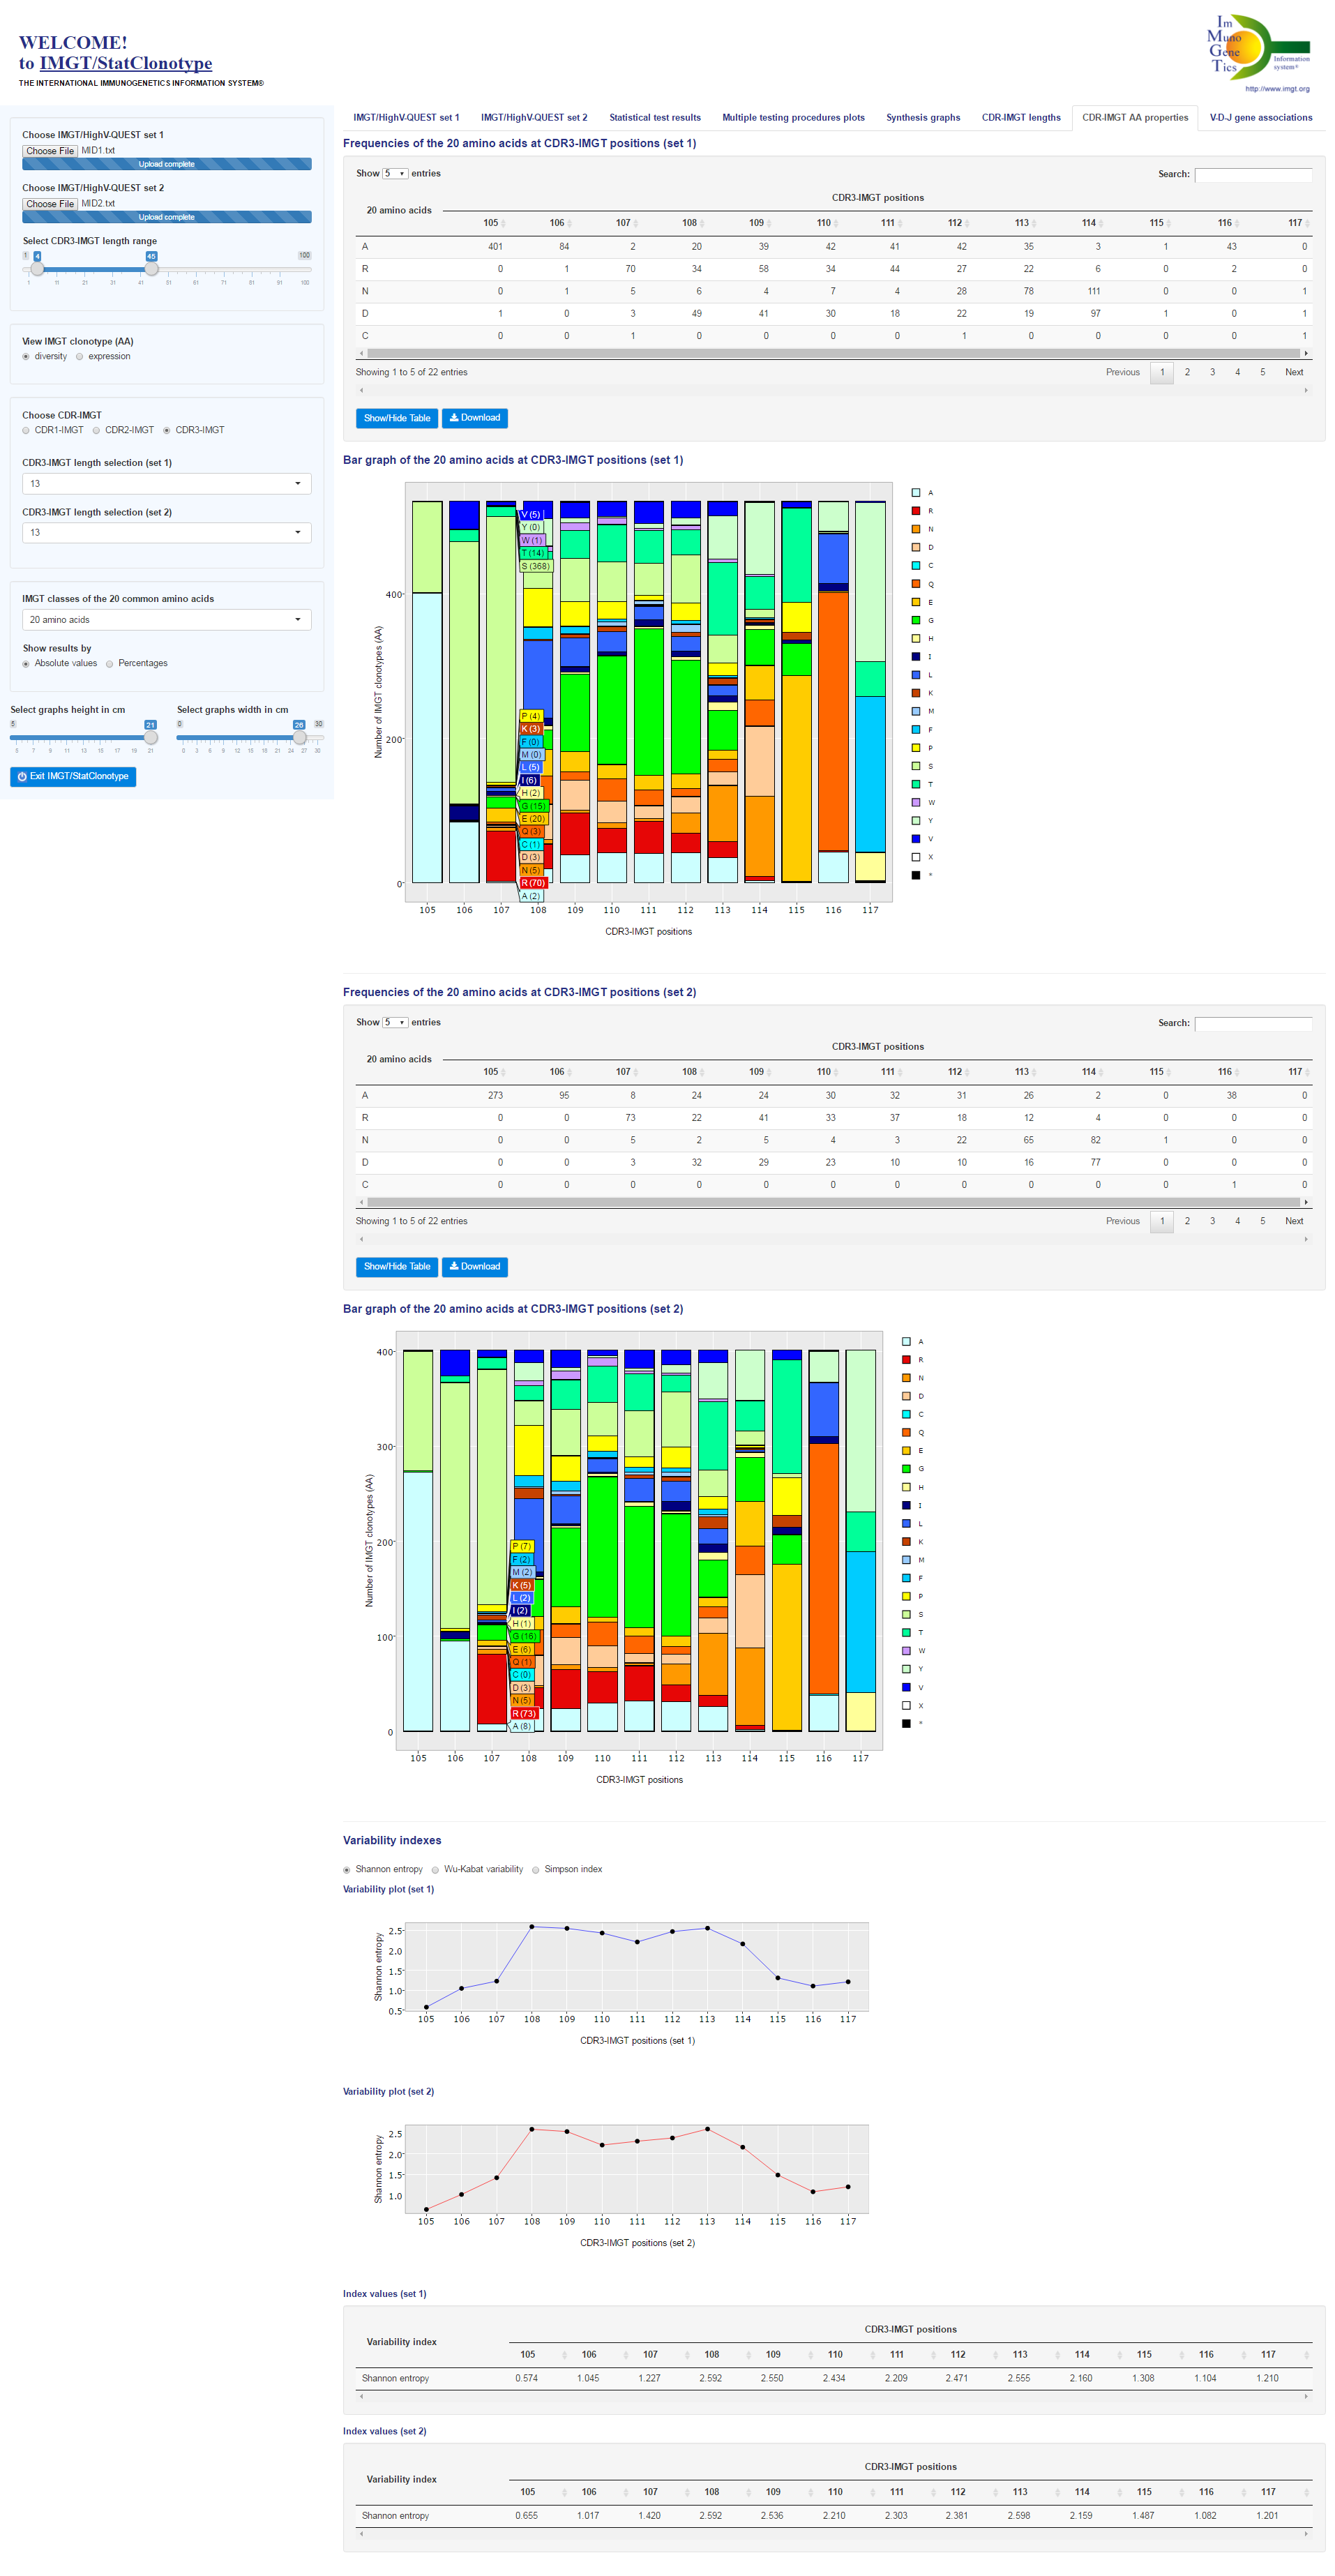
 Reminder: Only alleles of genes having significant differences in proportions validated by all multiple testing procedures are analyzed and visualized.
Note that: CDR-IMGT lengths (x-axis values) are not necessarily successive in graphs because only lengths found in one or both of compared sets are displayed.
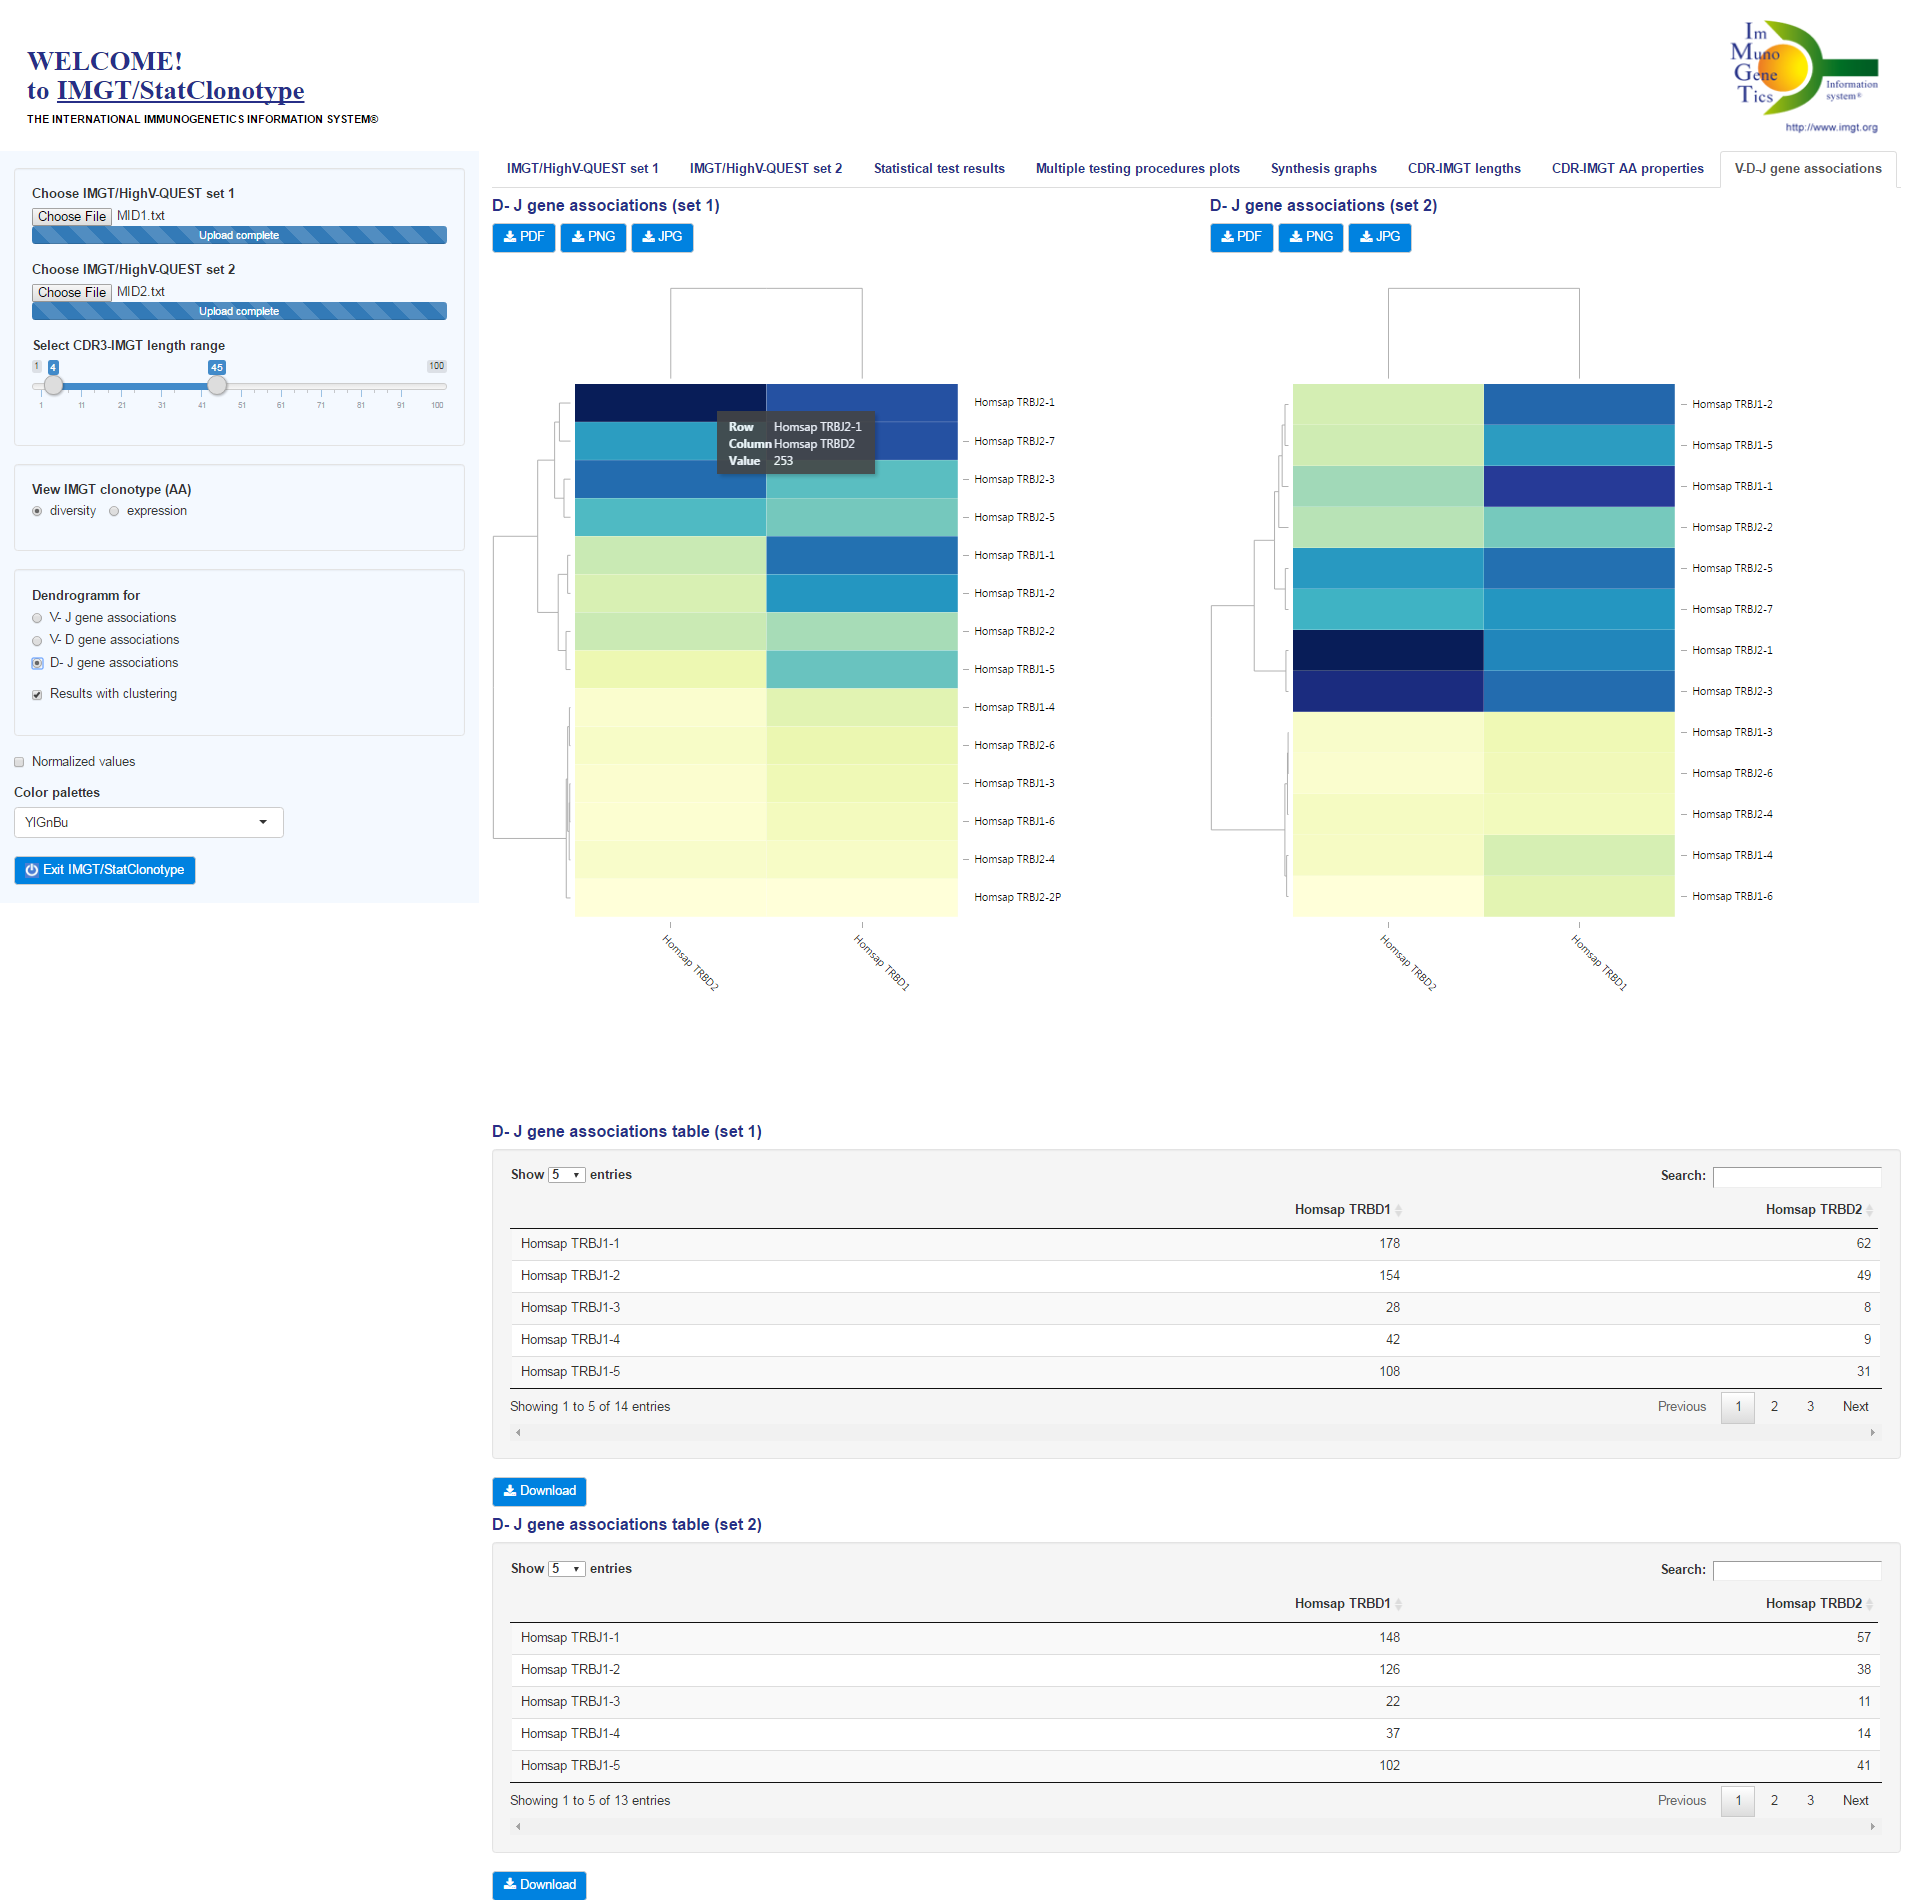
Reminder: Only alleles of genes having significant differences in proportions validated by all multiple testing procedures are analyzed and visualized.
Note that: CDR-IMGT lengths (x-axis values) are not necessarily successive in graphs because only lengths found in one or both of compared sets are displayed.
| IMGT/StatClonotype implementation and developments |
The IMGT/StatClonotype tool was developed by Safa Aouinti (IMGT, LIGM, Montpellier, France) using R software (version 3.3.0) and Shiny framework [11].
Interactive graphs are generated using ggplot2 [13] with plotly [14] and d3heatmap [15] packages.
This work was granted access to the HPC resources of CINES under the allocation 2014-036029 made by GENCI (Grand Equipement National de Calcul Intensif) and to Très Grand Centre de Calcul
(TGCC) of the Commissariat à l'Energie Atomique et aux Energies Alternatives
(CEA) under the allocation 036029 (2010-2016) made by GENCI
(Grand Equipement National de Calcul Intensif).
| IMGT/StatClonotype upgrades and versions |
The tab 'Multiple testing procedures plots' now displays interactive scatter plots and interactive line graphs with:
| 'IMGTStatClonotype' R package update |
Software material and data coming from IMGT server may be used for academic research only,
provided that it is referred to IMGT®, and cited as
"IMGT®, the international ImMunoGeneTics information system® https://www.imgt.org
(founder and director: Marie-Paule Lefranc, Montpellier, France)."
References to cite:
Lefranc, M.-P. et al.,
Nucleic Acids Res., 27:209-212 (1999); doi: 10.1093/nar/27.1.209
Full text
Cover;
Ruiz, M. et al.,
Nucleic Acids Res., 28:219-221 (2000); doi: 10.1093/nar/28.1.219
Full text;
Lefranc, M.-P.,
Nucleic Acids Res., 29:207-209 (2001); doi: 10.1093/nar/29.1.207
Full text;
Lefranc, M.-P.,
Nucleic Acids Res., 31:307-310 (2003); doi: 10.1093/nar/gkg085
Full text;
Lefranc, M.-P. et al.,
In Silico Biol., 5, 0006 (2004) [Epub], 5:45-60 (2005);
Lefranc, M.-P. et al.,
Nucleic Acids Res., 33:D593-597 (2005); doi: 10.1093/nar/gki065
Full text;
Lefranc, M.-P. et al.,
Nucleic Acids Res., 37:D1006-1012 (2009); doi: 10.1093/nar/gkn838
Full text;
Lefranc, M.-P. et al.,
Nucleic Acids Res., 43:D413-422 (2015); doi: 10.1093/nar/gku1056
Full text.
For any other use please contact Marie-Paule Lefranc
Marie-Paule.Lefranc@igh.cnrs.fr.


© Copyright 1995-2026 IMGT®, the international ImMunoGeneTics information system® | Terms of use | About us | Contact us